The Real Estate Investable Universe 2014
Friday, September 19, 2014
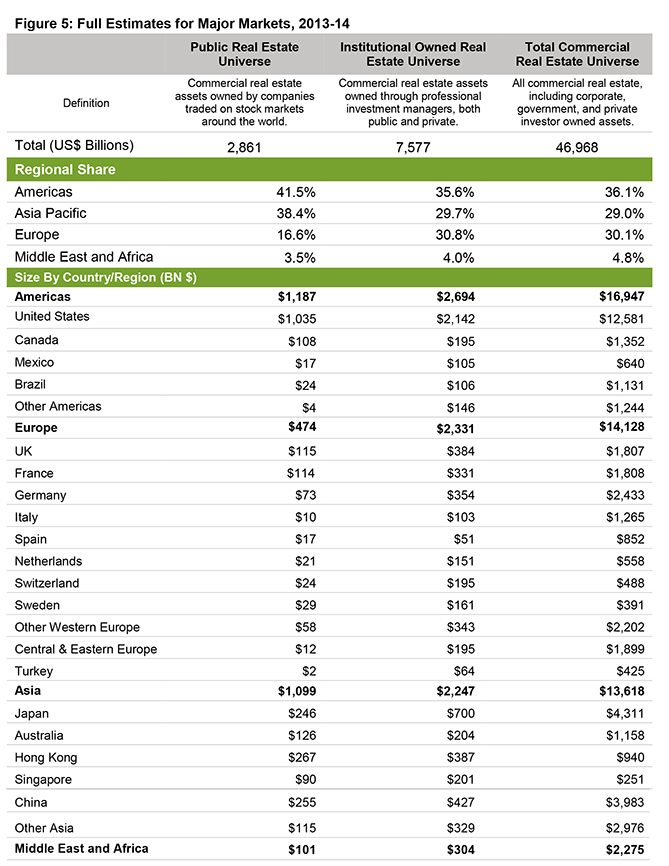
In our latest Real Estate Investable Universe update, we estimate that institional investors – one third of them public real estate companies – own $7.6 trillion of commercial real estate, approximately 16% of the total value of global commercial real estate. This absolute size estimate, and its segmentation for different owner types and across countries, provides a baseline for assessing property allocations and the impact of capital market flows on real estate.
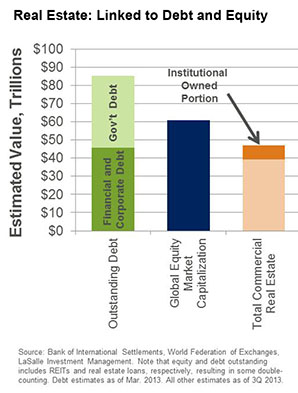
Global real estate capital markets are closely linked to the broader capital market for equities and debt. Differences in relative value trigger capital flows between real estate and other asset classes, which then interact with the supply of property investment opportunities to drive trends in property pricing and transaction volume.
The current amount of institutional-owned real estate, while large, is still one order of magnitude smaller than overall debt outstanding and global equity market capitalization. Institutional-owned real estate is equal to 12% of equity market capitalization and 9% of total debt outstanding. As a result, small allocation shifts from debt and equities can produce larger relative movements in real estate capital flows. For example, if all investors shifted just 1% of their government bond portfolios to real estate, it would imply a substantial 5% increase in institutional-owned real estate value.
Capital flows to real estate have picked up over the last three years in North America and Asia Pacific, with signs of greater strength also now appearing in Europe. Improvements in real estate transparency and the emergence of new retail capital vehicles are making property attractive to a broader group of investors. Moreover, risk-free government bond yields have remained near record lows in the G7.
How has real estate absorbed these inflows? Real estate is somewhat inelastic – while construction continually increases the built stock, at most it does so at a rate of a few percentage points each year – so it is not surprising that capital inflows have resulted in strong value increases and yield compression in many markets. In some, strong inflows have created an apparent "wall of capital", with many investors pursuing a small number of available properties. This upward pressure on values is real and rewards disciplined buyers that are more selective.
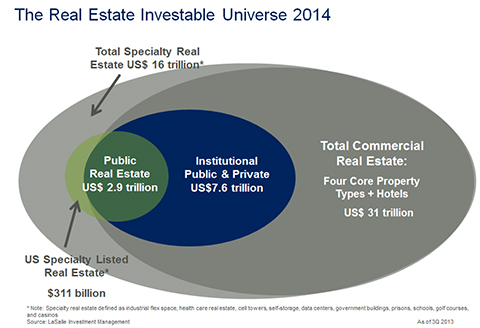
While slow to adjust in the short term, the stock of institutional real estate is much more elastic over the long term. Several factors act as a counterweight to the "wall of capital". With nearly $40 trillion worth of real estate not yet owned by institutional investors, there remains significant room for real estate to absorb new institutional capital. Inflows are finding new markets and specialty property types. Investor perceptions of what building types are "investable" are changing as the transparency and performance history of niche property types, like medical offices, student housing, and truck terminals, increases. Over 30% of the gross asset value of US public real estate companies is already in specialty properties, from data centers to life science buildings. Yet specialty ownership is just 5% of total institutional capital today. In Figure 2 on the first page, we highlight the large portion of total real estate that falls outside the four core property types. The composition of institutional ownership is likely to broaden going forward, following the US REIT market and holding a greater allocation to niche property types.
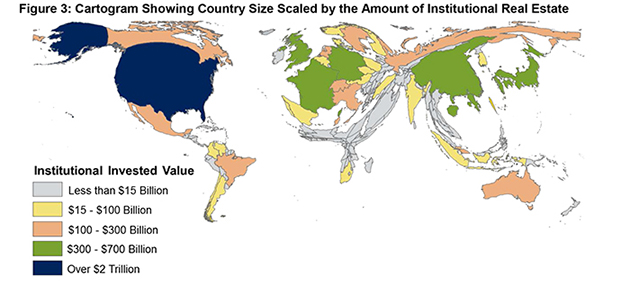
Institutional quality real estate is concentrated in a handful of large, developed economies, as shown in Figure 3. This cartogram rescales the area of each country based on the respective size of its institutional invested capital. Large countries by geographic area, but with less relative institutional real estate, like Russia and India, are compressed while markets like Japan and France swell. The seven largest markets – shown in green and blue – account for 62% of global institutional real estate.
In 2013, institutional real estate remained fairly evenly split across the Americas, Europe, and Asia-Pacific regions. The Americas accounted for 36% of global value, Europe held 31%, and Asia-Pacific was similar to Europe at 30%. Because our estimates are in US dollars, exchange rate movements drive year-to-year changes as much as growth in underlying investment. In the last year, these exchange rate movements had an especially large impact on Japan's institutional real estate size in USD.
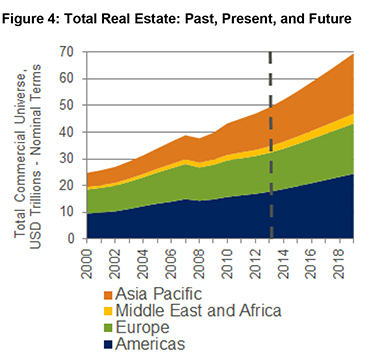
Notwithstanding year-to-year volatility in the exchange rates, Asia-Pacific continues grow its share of the global real estate universe, as shown in Figure 4. The region is forecast to surpass Europe based on its share of total commercial real estate over the next two years and account for 40% of all growth in commercial real estate through 2020.
Definitions and Methodology
Public Real Estate Universe
The $2.9 trillion USD listed real estate universe is the gross value of commercial real estate assets (GAV) owned by companies traded on stock markets around the world, using the latest data available as of 30 September 2013. GAV combines net asset value and debt, so it is a better measure of the underlying real estate owned by public firms than NAV or market capitalization alone. LaSalle Investment Management Securities is the primary source for this data. They actively track public real estate NAVs and debt in the largest developed and emerging markets. The markets covered by LaSalle Investment Management Securities represent 83% of public universe GAV.
For several emerging markets, such as the Philippines and the United Arab Emirates, we use listed property company enterprise values. This data is collected from Citigroup, the S&P Global Property Index, and Bloomberg. We include listed companies that are long-term holders of real estate and exclude companies whose primary business is residential homebuilding. Our estimates include vertically-integrated development firms that are also holders of commercial property.
Institutional Public and Private Real Estate Universe
The $7.6 trillion USD institutional real estate universe encompasses the commercial real estate assets owned by institutions, including REITs, pension funds, pooled private funds, and endowments. This universe is smaller than the total amount of institutional-grade stock because it is restricted to only those properties currently within institutional portfolios. It is based on a combination of primary data gathered by IPD (Investment Property Databank) in 25 developed markets and LaSalle estimates for 59 markets based on the developed market ratio of institutional real estate to GDP.
For the 25 developed markets covered by IPD, we start with IPD's year-end 2012 estimate of the total size of the institutional invested universe. This is a bottom-up estimate that includes all properties owned through professional managers. IPD's estimates are the best available and are larger than the value of assets tracked by the IPD and NCREIF market indices because not every investment manager reports to these indices. We update IPD's year-end estimates through 3Q 2013 by calculating the impact of year to date changes in exchange rate and year-to-date value changes.
For the 59 markets without primary IPD data, we use a methodology based on the ratio of gross domestic product (GDP) per capita and GDP to real estate stock. We include an estimate for the residual "Rest of the World" real estate value for small economies not included individually. We estimate that only 1.3% of institutional-owned real estate is in these small economies.
Youguo Liang and Willard McIntosh developed a GDP-driven investable universe methodology in their 1999 paper Global Commercial Real Estate. The calculation is as follows:

First, each nation's purchasing power parity (PPP) GDP per capita is divided by US GDP per capita. That ratio is then taken to the 1/3 power. This adjustment takes into account the fact that more developed countries, as measured by GDP per capita, have a greater volume of institutionally owned real estate, but that the relationship is not one-to-one. Second, GDP is multiplied by this adjustment factor to create an adjusted GDP. Third, we multiply by the average ratio of real estate to GDP in the countries with IPD data. Based on the 2013 estimates for the nations covered by IPD, the average ratio of institutional real estate to GDP is 0.15 – very similar to the ratio for the last several years.
We recognize that this top-down methodology is likely to be less accurate than bottom-up local estimates. To address this in Hong Kong and Singapore, we use current inventory and yield data to produce bottom-up estimates of total real estate value. However, for most developing markets, local information is incomplete or nonexistent, making the top down approach the best available.
Total Commercial Investable Universe
The $47.0 trillion estimate of the total commercial universe is the aggregate value of all commercial real estate worldwide, including corporate, government, and private investor owned assets. This estimate has been revised upward significantly from previous years based on a methodological change. This year, the total commercial estimate is in nominal 2012 dollars, rather than real 2005 US dollars used in past years. Due to the inflation between 2005 and 2012, combined with the impact of a weaker dollar in 2012 versus 2005 (which increases the USD values for most markets outside the US), our estimate increased.
The total commercial estimate includes property of all quality types and is intended to represent the value of all assets that could be bought by investors, even if they are unlikely to do so. We incorporate the results of a 2009 census of all US real estate by a team at CoStar , rolled forward to 2013-14 based on real changes in the value of US structures, as estimated by the US Bureau of Economic Analysis.
With this adjusted estimate of total US real estate value, all other countries are then estimated using the same GDP-based methodology described above for institutional real estate in countries without IPD data. Our $47 trillion estimate is useful for putting the asset class as a whole into perspective and comparing the relative size of different regions, but with notable caveats: there is a large margin of error for smaller markets and the year-to-year changes in this estimate are not meaningfully driven by global real estate appreciation. The ratio of the total nominal value of commercial (exclusive of owner-occupied residential) to world GDP is now approximately 0.65.
December 2013
Authors and Contributors
Jacques Gordon (Chicago) jacques.gordon@lasalle.com
Jeff Bean (Chicago) jeff.bean@lasalle.com
Daniel Mahoney (Chicago) daniel.mahoney@lasalle.com
David Baskeyfield (London) david.baskeyfield@lasalle.com
Sander Bunck (Amsterdam) Sander.Bunck@lasalle.com
Rich Kleinman (Chicago) richard.kleinman@lasalle.com
Matthew Sgrizzi (Baltimore) matthew.sgrizzi@lasalle.com
Yu Jin Ow (Singapore) YuJin.ow@lasalle.com
John Wallace (Hong Kong) John.Wallace@lasalle.com
Michelle Yang (Baltimore) Michelle.Yang@lasalle.com
Lawrence Ye (Hong Kong) lawrence.ye@lasalle.com
This information is intended to assist professional investors in deciding whether they wish to consider the investment further. This publication does not constitute an offer to sell, or the solicitation of an offer to buy, any securities or any interests in investment funds sponsored by, or the advisory services of, LaSalle Investment Management and is subject to correction, completion and amendment without notice. Any such offer, if made, will only be made by means of a confidential prospectus. The prospectus will include information regarding investment risk and investors should have the financial ability and willingness to accept these risks. All information obtained from third party sources is believed to be reliable and current, but accuracy cannot be guaranteed and we do not undertake to update any information contained in this document. All assumptions, figures and calculations contained in the information must be independently verified by the professional investor. This publication has been prepared without regard to the specific investment objectives, financial situation or particular needs of recipients. No legal or tax advice is provided. Recipients should independently evaluate specific investments and trading strategies. By accepting receipt of this publication, the recipient acknowledges that this publication is confidential and agrees not to distribute, offer or sell this publication or copies of it and agrees not to make use of the publication other than for its own general information purposes.
Copyright © 2013 LaSalle Investment Management. All rights reserved. No part of this publication may be reproduced by any means, whether graphically, electronically, mechanically or otherwise howsoever, including without limitation photocopying and recording on magnetic tape, or included in any information store and/or retrieval system without prior permission of LaSalle Investment Management.